Remember the Trix Rabbit and Smokey the Bear? Sure you do. Animated ads have long been a staple of children’s TV. But the format is used much more sparingly among ads targeted at a broader audience. We reviewed data from more than 12,000 ads that aired over the past two years. Among these, we identified 209 (1.7%) that are fully animated, spanning categories as diverse as Investments, Car Rental, Footwear and, of course, Video Games.
There are many examples of highly effective animated ads. A few weeks ago, Perdue Chicken earned Ad of the Week honors with an animated spot called “Jim Perdue: You Are What You Eat” (Ace Score 646). And M&M’s snagged Brand of the Year recognition in 2012 thanks to its humorous series of ads featuring talking M&M’s. But these high-scoring ads tend to be the exception, not the rule. In fact, animated ads underperform their non-animated counterparts by 16 points on average (see Chart 1). And this trend is consistent across most categories. Among the 19 categories that aired at least three animated ads over the past two years, 13 of them (68%) had animated ads with a lower average score than non-animated ads within the category.
Chart 1 – Animated Ads Tend to Underperform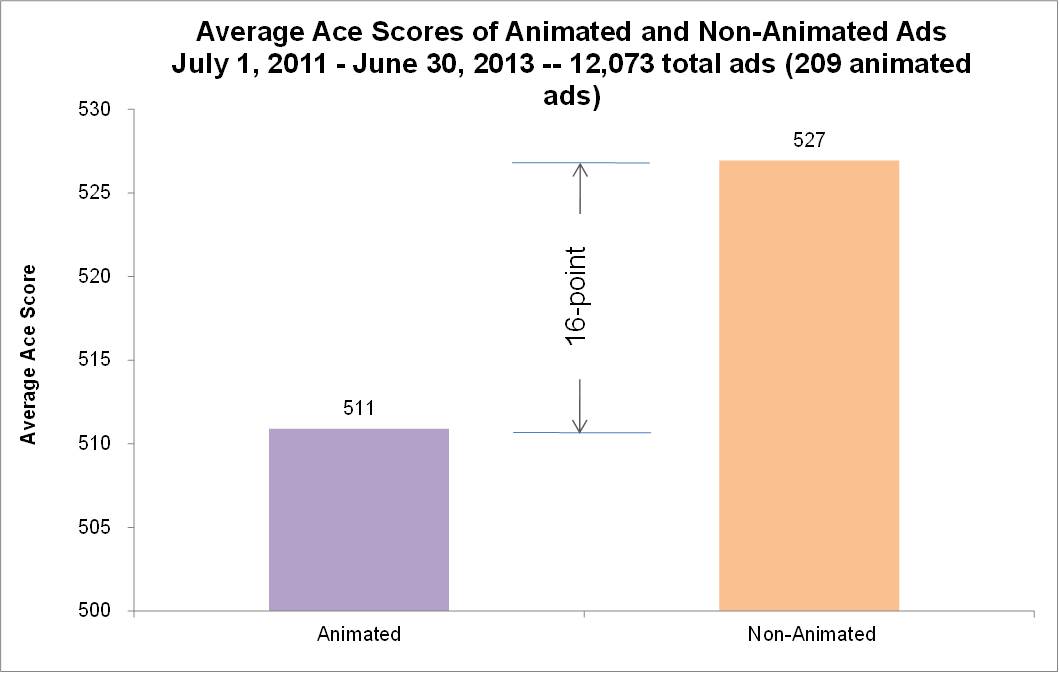
Drilling into the component scores, we found that the performance gap is widest in Information and Relevance, and narrowest in Attention and Likeability (see Chart 2). Animation, particularly when it’s lighthearted, is clearly not the format of choice for delivering informative content. The Relevance gap is selective. In some categories (e.g., Snacks, Soda, Candy & Gum) relevance doesn’t suffer when ads are animated. But in others (e.g., Investments, Footwear, Car Rental) the relevance gap is wide.
Chart 2 – Score Gaps Vary by Component for Animated vs. Non-Animated Ads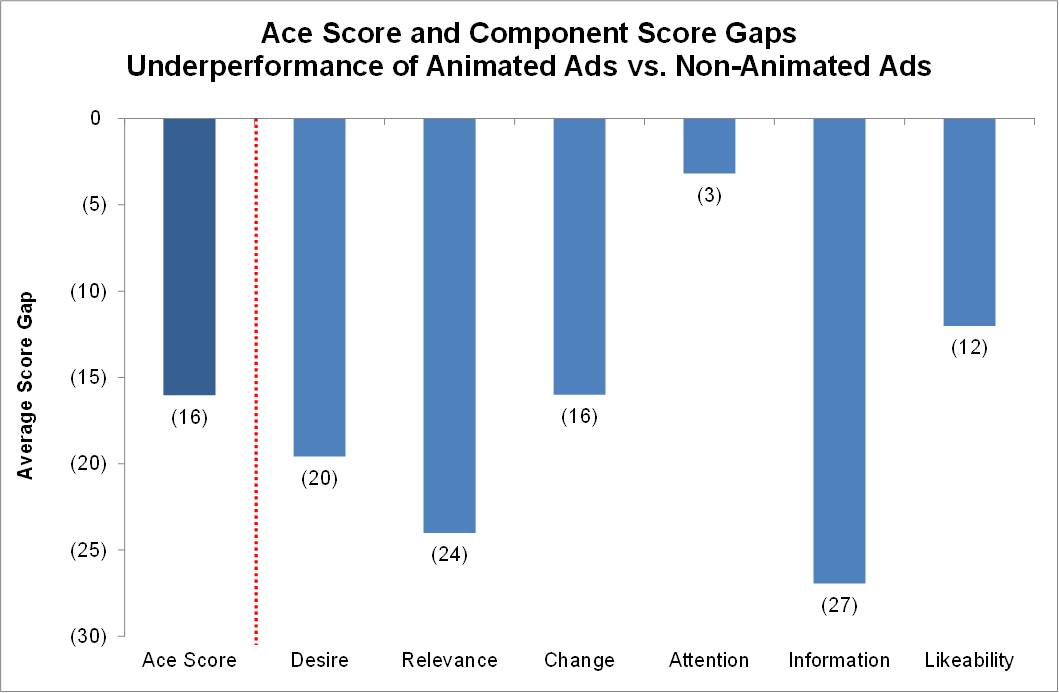
From a demographic perspective, we found that animated ads underperform non-animated ads much more significantly for female viewers than for male viewers. The male gap is 3 points, whereas the female gap is 25 points (see Chart 3). This skew is widest within the Investments and Liquor categories, but is reversed in Footwear, QSR and a handful of other categories. In another demographic vein, we found that age is a significant factor in animated-vs.-non-animated ad effectiveness. The score gap is much wider among older audiences than it is among younger audiences (see Chart 4) – over the years we appear to outgrow the need for our cartoon fix.
Chart 3 – Demographic Ace Score Gaps: by Male vs. Female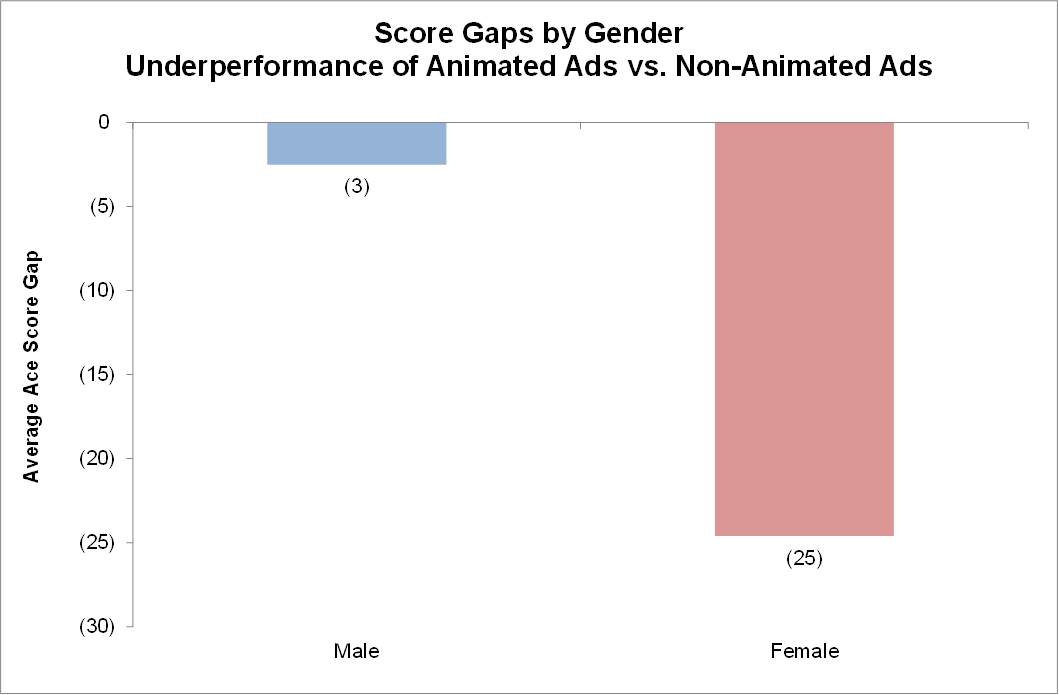
Chart 4 – Demographic Ace Score Gaps: by Age Range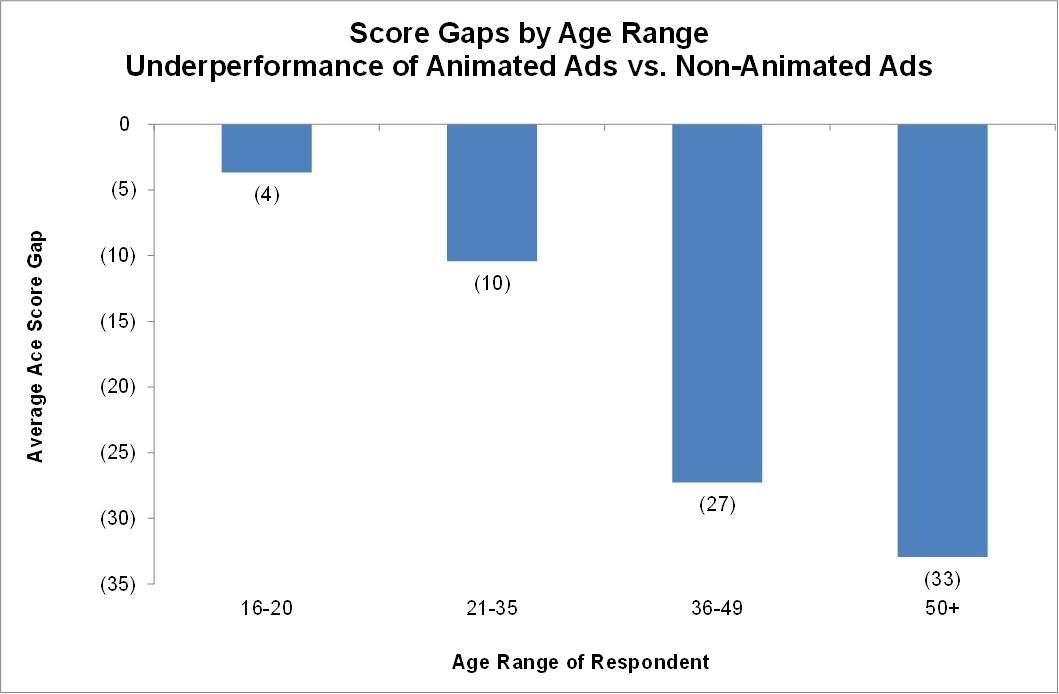
To be sure, animated ads tend to be most effective when they’re targeted at males and younger males in particular. Creative directors are certainly wise to this reality. A list of the categories that aired the most animated ads as a percentage of total ads show that Video Games rise to the top (see Table 1). Other categories that skew male (e.g., Investments, Car Rental and Liquor) also appear among the top 10 categories of the 90 that we track. See our recent blog post “He Said, She Said” for more details on male-female skew.
Table 1 – Categories with the Highest Percentage of Animated Ads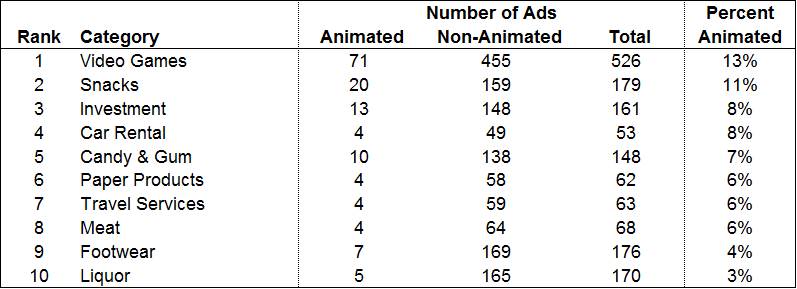
Finally, we pulled together a list of the diamonds in the rough. The top-scoring animated ads over the past two years reveal a diverse group of brands that aired great creative spots utilizing the animated format. Previously mentioned Perdue and M&M’s are both on the list, as are strong efforts from the likes of AT&T, Macy’s, Clorox and others. These are the spots that overcame the demographic handicaps inherent to the animated format. We’ll be watching for more of these stand-out performers in the future, with due recognition in our weekly, quarterly and annual awards.
Table 2 – The Most Effective Animated Ads since July 1, 2011 (ranked by Ace Score)