We recently released a set of features into our client interface that allows marketers to analyze ads in new and deeper ways. With the media and advertising landscape ever evolving, we pride ourselves on continuous innovation – both in terms of introducing new metrics for advertisers to use, and in the visualization and accessibility of that data. We believe that our clients should have realtime access and the ability to determine for themselves based on a variety of angles, what levers a piece of creative fires on.
Ad Personality Profiles
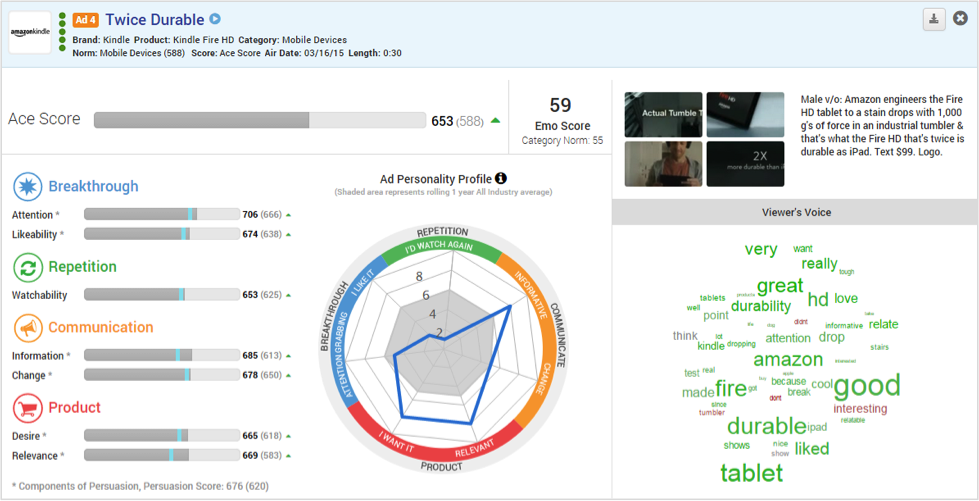
Anchoring the new features in this release are Ad Personality Profiles that look at our component measures in a new way. Personality Profiles provide insight into what powers the holistic Ace Score. Understanding which measures are the main drivers of an ad are key to effective and efficient decision making. For instance, an ad that is strong on the Communication measures of Information and Change may need higher frequency to effectively get their message across while a high Breakthrough spot grabs and keeps Attention immediately.
Norms by Ad Length
One of the most common questions we get is “what are the differences between a :15 and :30 ad?” Now you will be able to pull normative data based on ad length inside the interface! Across all industries we see an average of 15 point drop from :30 to :15 for all components, but there are certainly category nuances at stake. With additional ad length insights advertisers can find efficiencies for media planning, as well as untapped opportunities based on competitors’ performance.
Access Ad Length norms via the custom norm creation tool from the Norm drop down menu .

Sample Size
With the level of customization as deep as it is in our platform (triple cross custom sample!), we wanted to be sure that all decision making is done based on a significant sample size. Now when you slice the data down from our 500 person, general population sample, you will know exactly how many people are in the selected group.
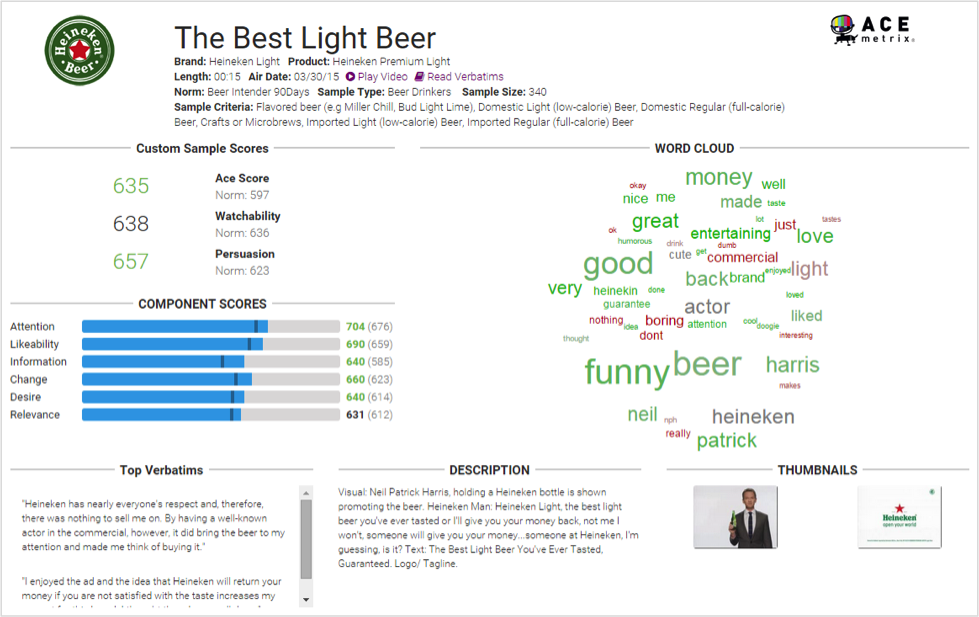
In Profile, Read, and Brand Recognition tabs, sample size will be shown in the header for each individual ad as seen below. In Chart, select the Table view icon from the icon options in the upper right corner to see the sample size for whichever slices you have selected.

Dual Score & Percent Chart Flavor
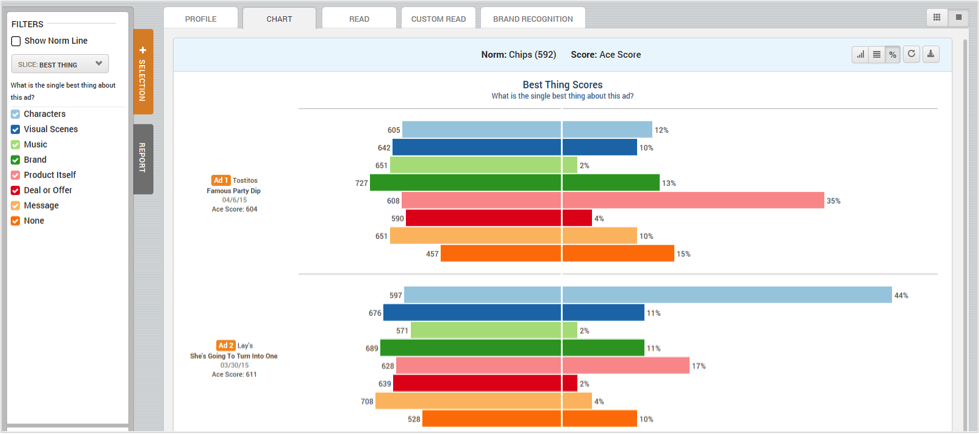
Our new Chart flavor gives users the ability to plot both the percentage of respondents for a given answer segment as well as the score. Access this Chart flavor by clicking on the icon labeled with a “%”mark. It can also be used in conjunction with our “flipped” Chart view which switches what is shown on the bars of the chart.
Verbatim Sorting by Component Score
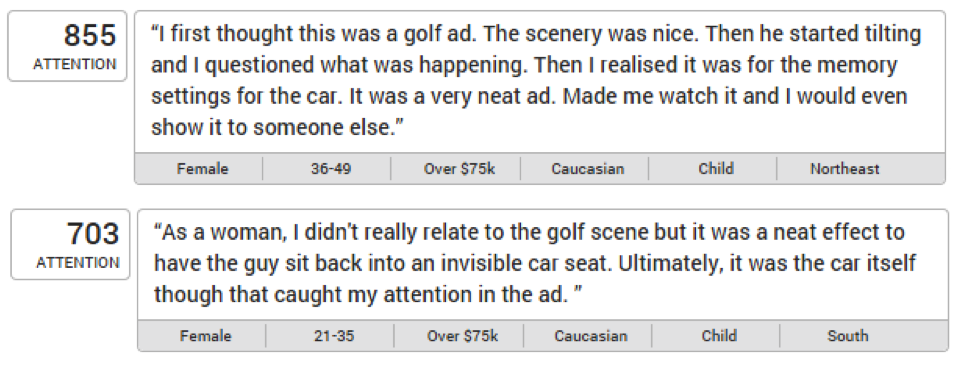
In our continued efforts to focus advertisers on evaluating their specific objectives for an ad, we now offer the ability to sort verbatim responses based on any component measure. Focusing on respondents that gave the ad a high Attention score, for instance, allows you to understand what specifically it was about the ad the made it Breakthrough with consumers.
Additionally, word clouds can now be color coded based on whichever Score Type you have selected. The size of the words in the word cloud is based on how many viewers used that word in their verbatim response. The color is based on the average score of people who used that word in their response. So, if you have Attention selected, coloring for the word will be based on the average Attention score of people who used that word in their response. The word clouds that appear in Profile are also affected by whichever score type you currently have selected.
Brand Recognition by Custom Scores
Continuing our ability to slice all our data by custom segments and demographics, you are now able to cut Brand Recognition data by Custom Scores as well as all of our Filter options. If you have a Custom Score, such as one year auto intenders, as seen in the example below, you can now access the Brand Recognition tab with your custom score selected.
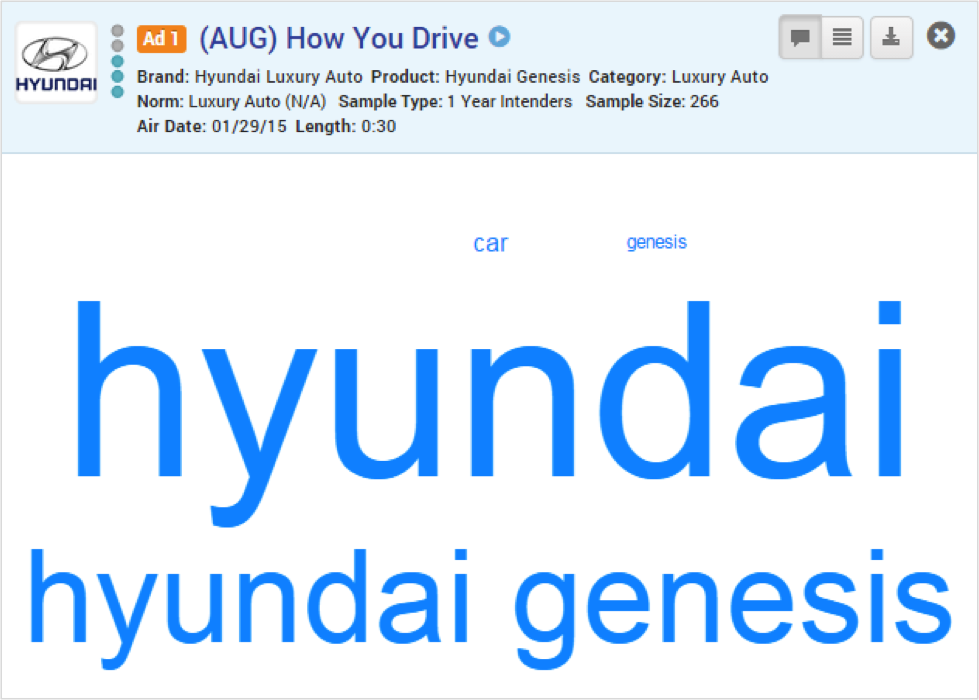
Additionally, you can use any of our Filter options seen on the left side of the screen to filter the Brand Recognition data. You could, for example, show the Brand Recognition counts for “current owners or users” by selecting the Personal Experience Question from the Filter drop-down.
Exporting and Sharing Data
You can now use the share functionality in the Profile tab to share ads with Custom Scores and Norms. The shared ads will reflect the Norms and Score Types that you have selected within the user interface.
In our Report tab, where you can download raw data customized any way you like, you will now have access to Emotional Sentiment scores in addition to the component measures.
We are very excited about these new features and are working hard on the next round of updates that will come later this quarter. Feedback is always appreciated, feel free to send us your questions or suggestions to feedback@acemetrix.com
Not a current Ace Metrix LIVE subscriber? Contact us today for a demonstration of the platform.